

The Current Status of the Tokyo Key Stations
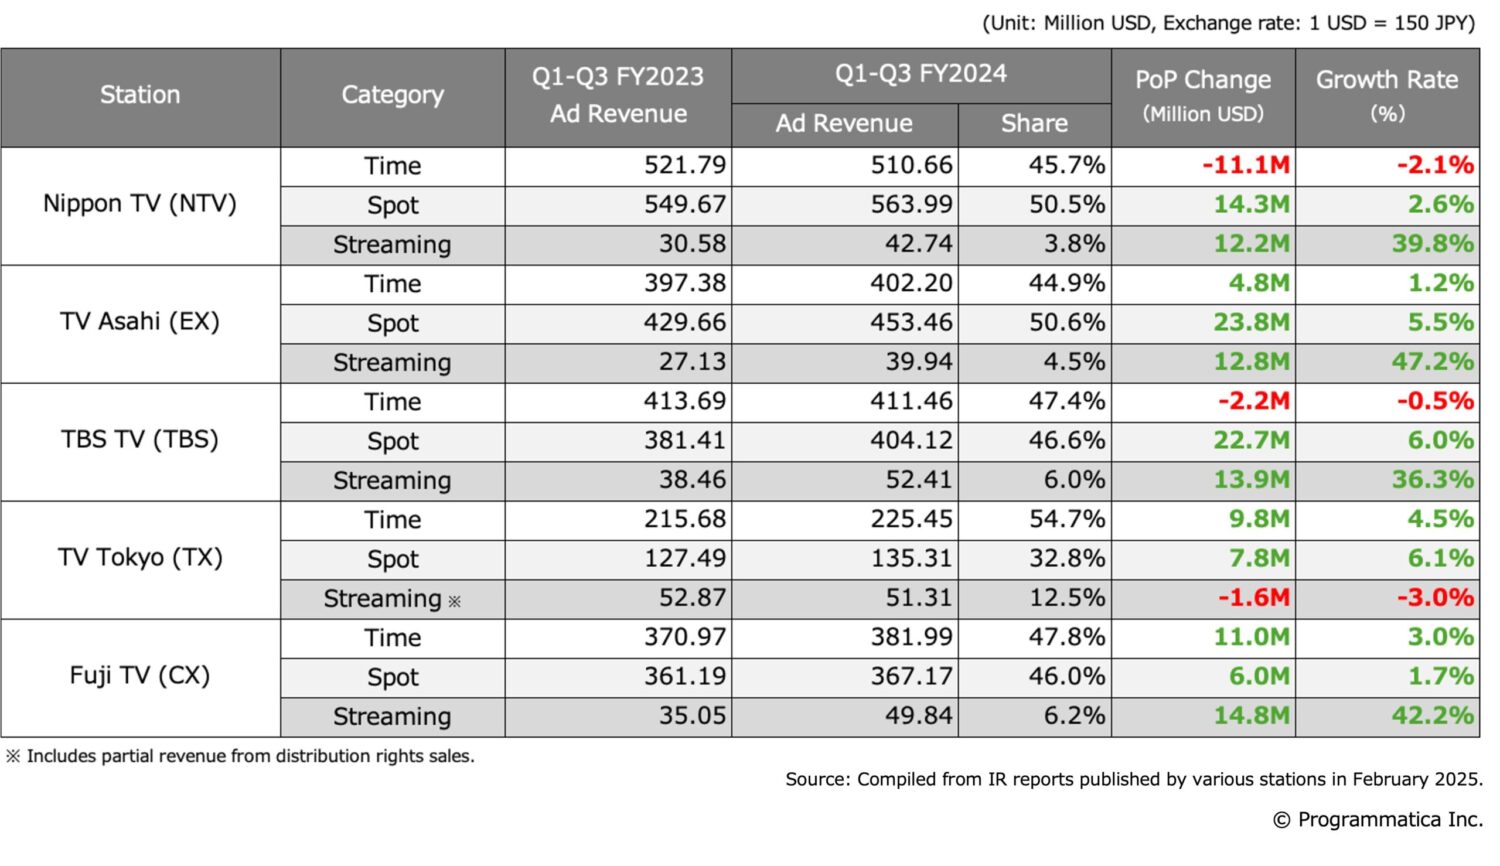
Summary of Advertising Revenue for Q1-Q3 FY2024
Programmatica has compiled a summary of the advertising revenue for Q1–Q3 FY2024, based on recent announcements made by Tokyo-based key stations.
Compared to FY2023, when all stations saw a year-on-year (YoY) decline in full-year revenue, FY2024 has shown a slight increase across stations through Q3, except for certain program sponsorships (time advertising in Japan). In particular, the spot advertising market performed well from June onward. However, overall costs increased due to the Paris Olympics (held from July 26 to August 11), leading to continued financial challenges, as reported in previous earnings documents.
Streaming advertising continues to show strong growth across all stations, but it still accounts for only around 4–6% of total advertising revenue and has not yet reached a scale that can replace traditional broadcasting. TV Tokyo (TX) reports a higher share than other stations, but this figure includes revenue from distribution rights sales. (YoY growth rate: -3.0%)
The theme of this PrograBLOG is “The Potential of Impression-Based TV Advertising Sales at Tokyo Key Stations,” and focuses on raising awareness of impression-based trading for TV commercials in Japan.
Due to the controversy over the suspension of commercials at Fuji TV (CX)—sparked by a scandal involving a former TV personality—it is difficult to predict the year-on-year revenue figures for the full fiscal year 2024. This uncertainty not only affects CX but also other stations. Therefore, in this edition of PrograBLOG, we will conduct the following examination based on the revenue figures from the first half of FY2024.
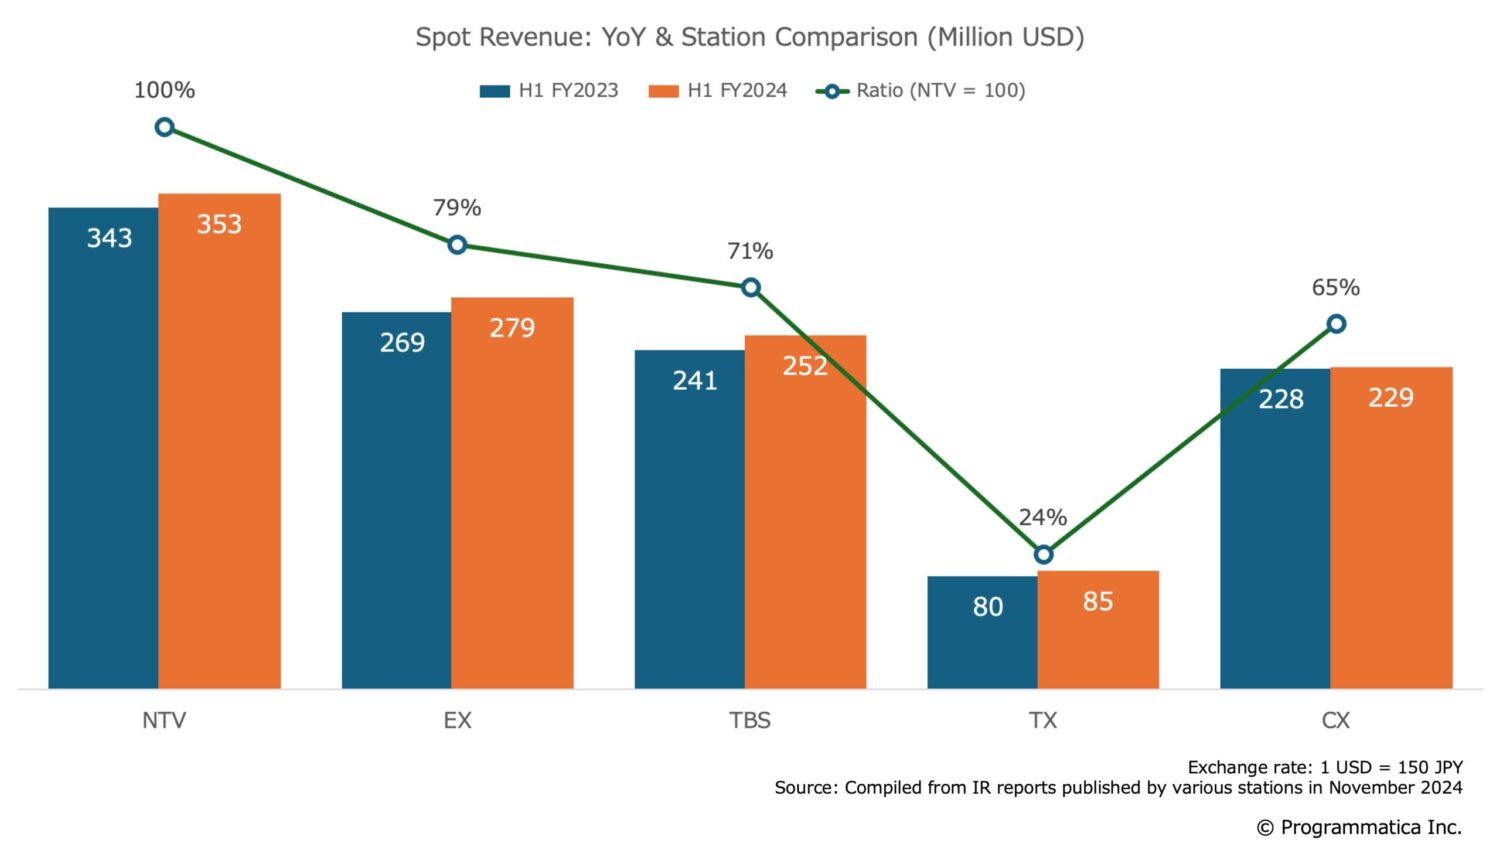
Comparison of Spot Advertising Revenue
Nippon TV (NTV) continues to lead the way in overall advertising revenue and spot and time advertising revenue and is still outperforming other stations. Regarding spot advertising revenue, different stations account for 65-80% of NTV (excluding TX). However, TV Asahi (EX) reported in its first-half financial results that it had recorded a 23.3% share of the Tokyo spot advertising market, tying its previous record (it was ranked second).
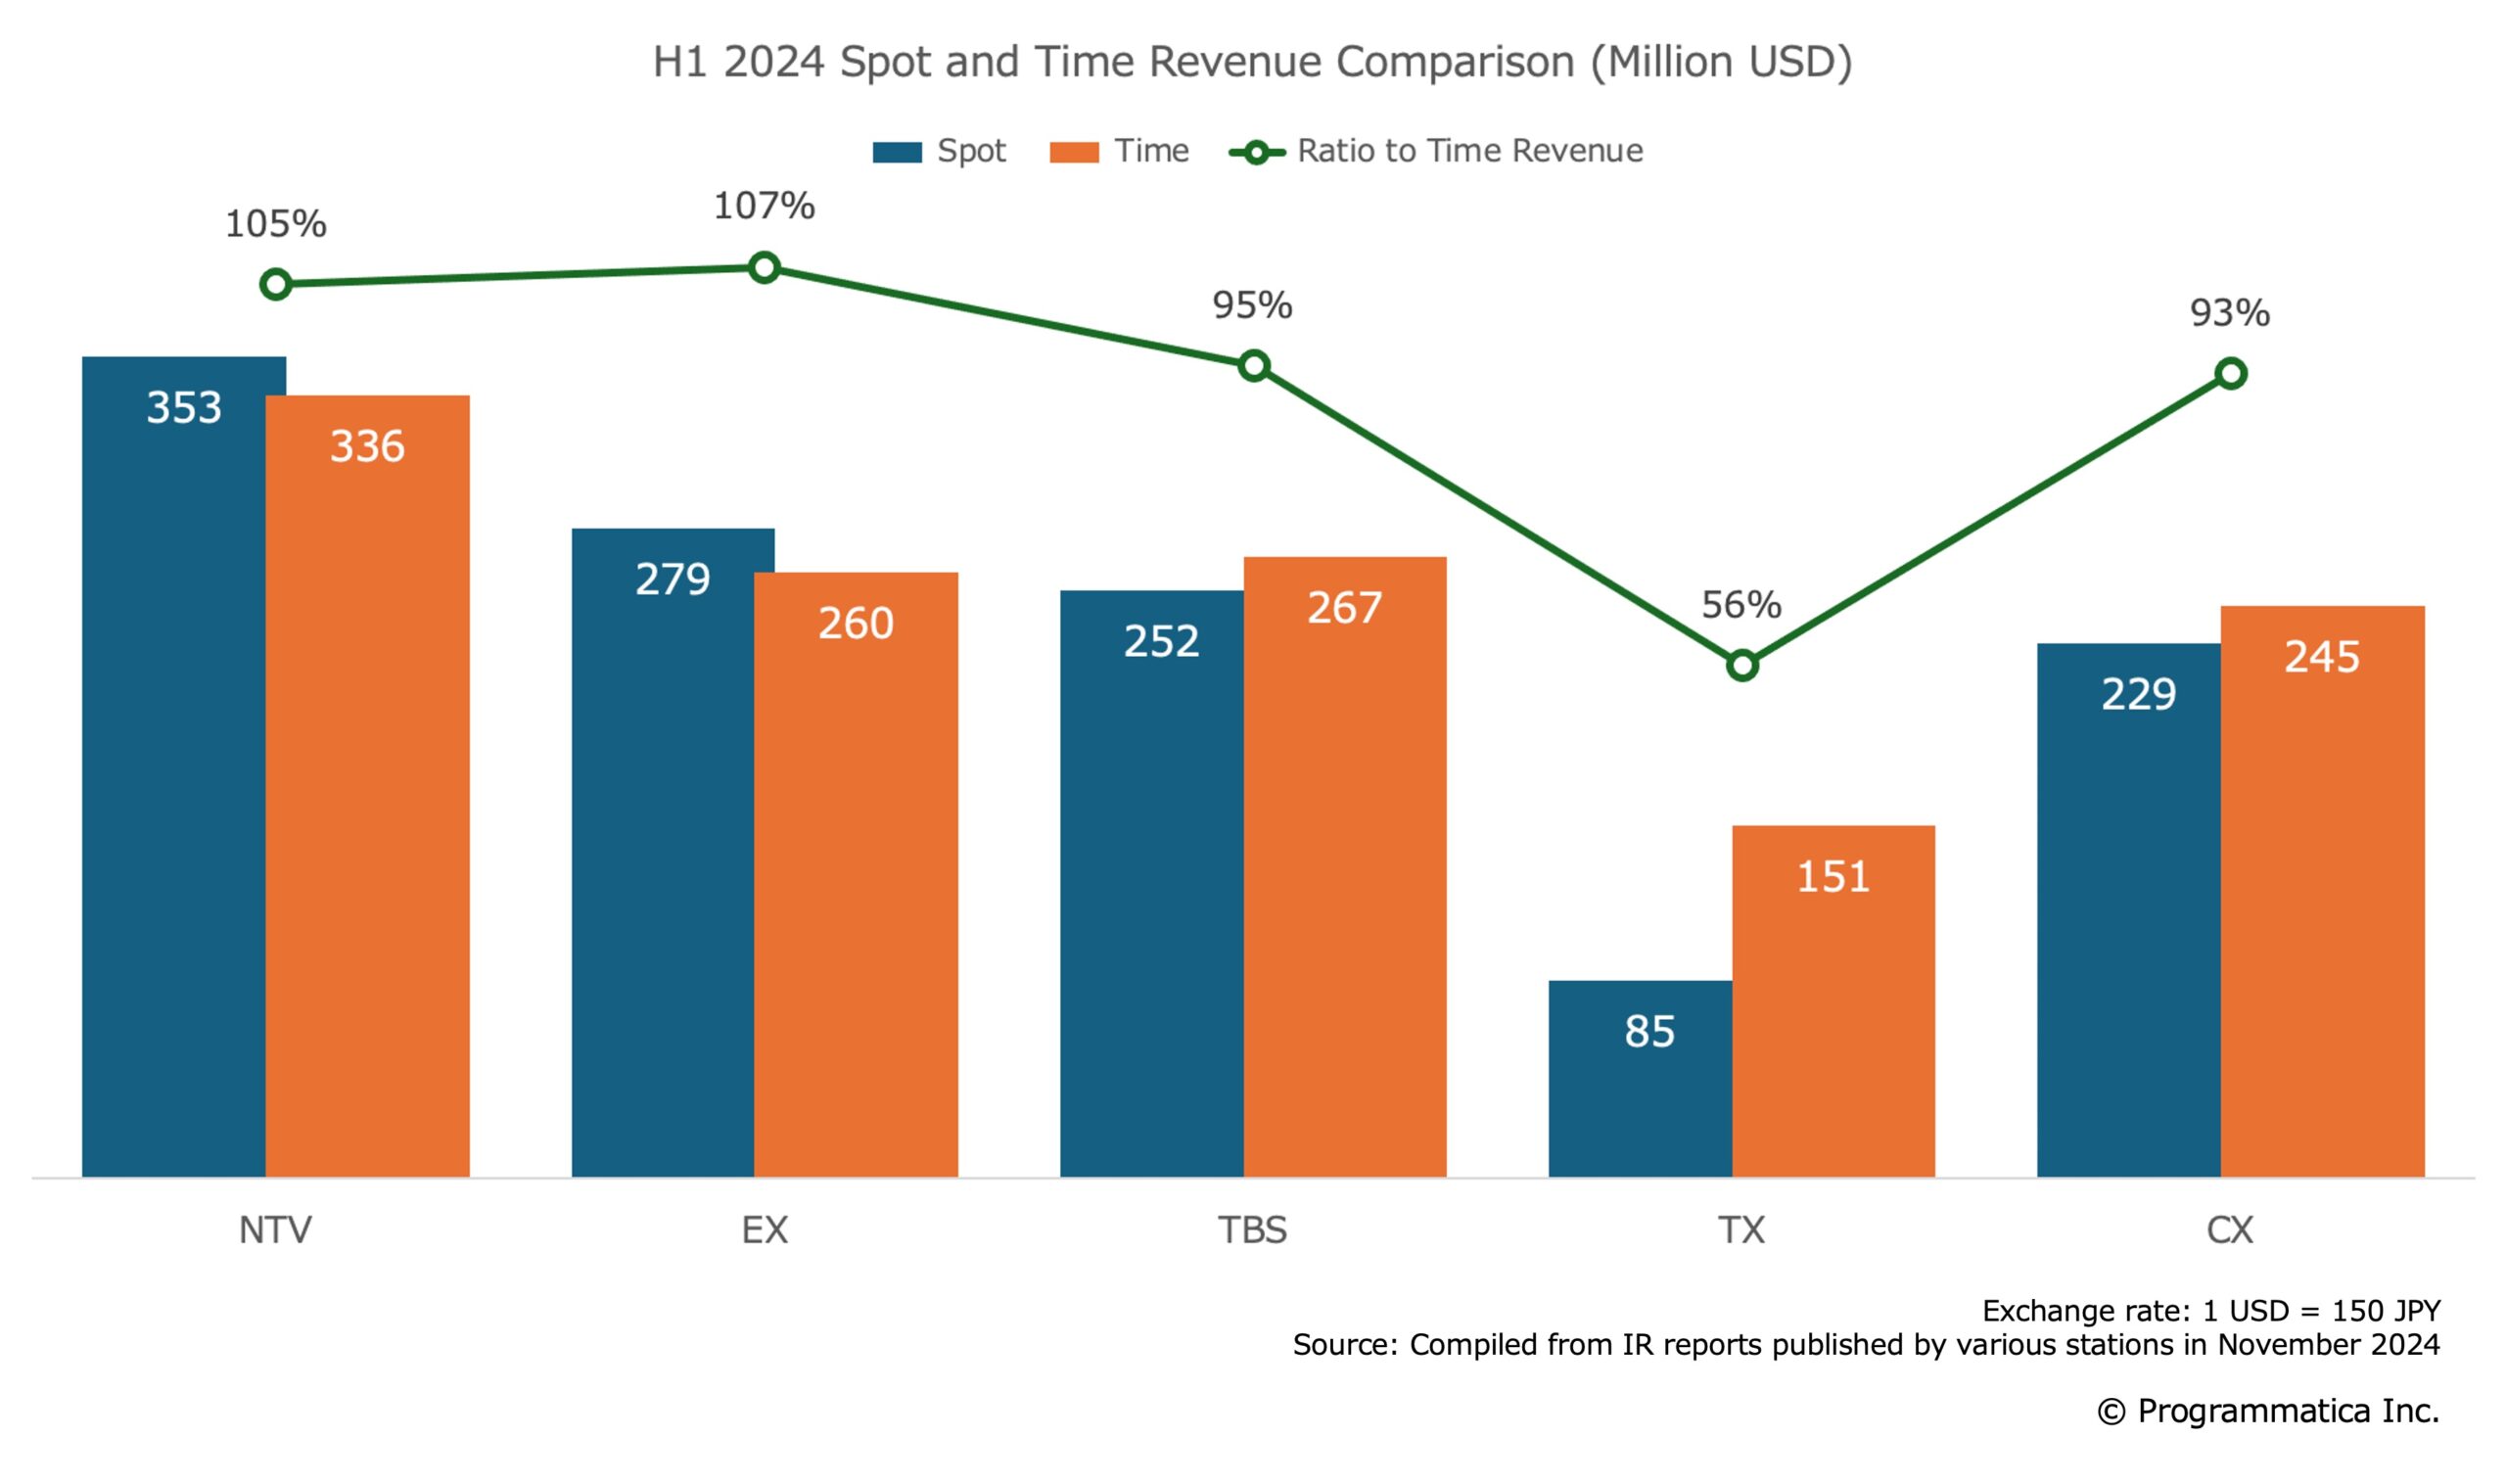
Comparison of Revenue from Spot and Time Advertising
When comparing revenue from spot and time advertising, NTV (spot-to-time revenue ratio: 105%) and EX (107%) generated more from spot advertising, while TBS TV (TBS, 95%), TX (56%), and CX (93%) earned more from time sales. This trend was also observed throughout 2023.
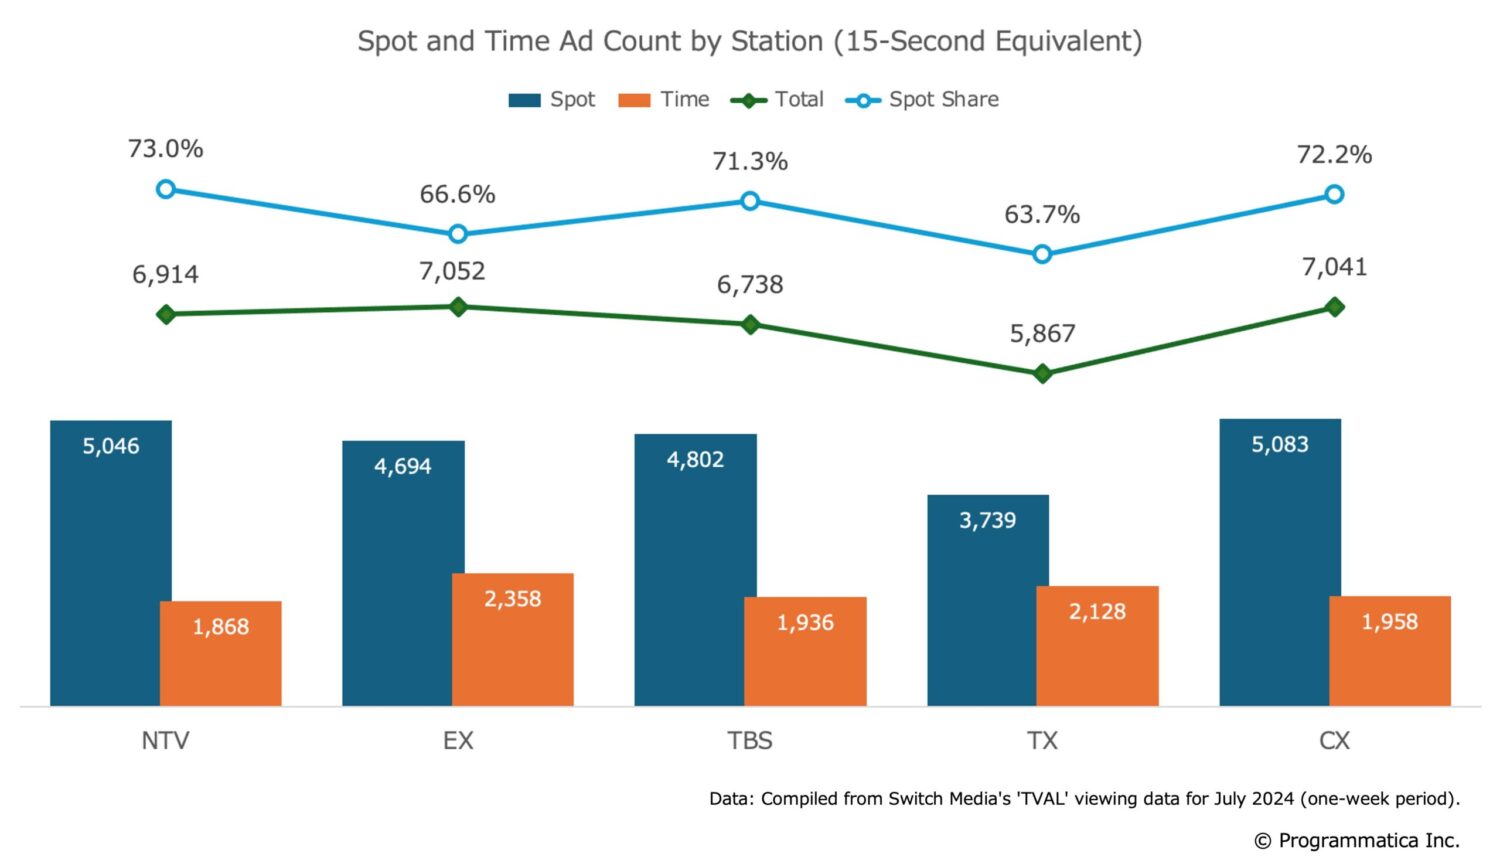
Comparison of Spot vs. Time Commercials
We used data from “TVAL,” a service provided by Switch Media, Inc., one of Japan’s leading TV audience data providers, to count the number of spot and time commercials (converted to 15-second units). When we included “program promotional slots” which are sometimes ambiguously classified as either programs or commercials, almost all broadcasters reached the total commercial volume limit* set by the Japan Commercial Broadcasters Association (JBA). Of these, approximately 70% were spot commercials. Therefore, simply increasing the number of commercial slots is unlikely to improve business performance. While it is possible to increase commercial airtime by utilizing sub-channels, we believe this approach would not be ideal from a viewer experience (UX) perspective.
* Under JBA standards, commercials must not exceed 18% of weekly airtime (about 7,250 15-second spots).
The unit price of TV advertising on Japan’s linear TV is surprisingly low. When comparing by CPM, the price difference can be nearly tenfold compared to premium Connected TV (CTV) advertising in streaming. One way to bridge this gap is by raising the unit price of TV commercials through impression-based trading. Additionally, increasing TV commercial unit prices via impression-based trading could also lead to a reduction in the total number of commercials, making TV ads more acceptable to viewers. This, in turn, could provide an opportunity to win back audiences to Japan’s linear TV, who have been drifting away in recent years.
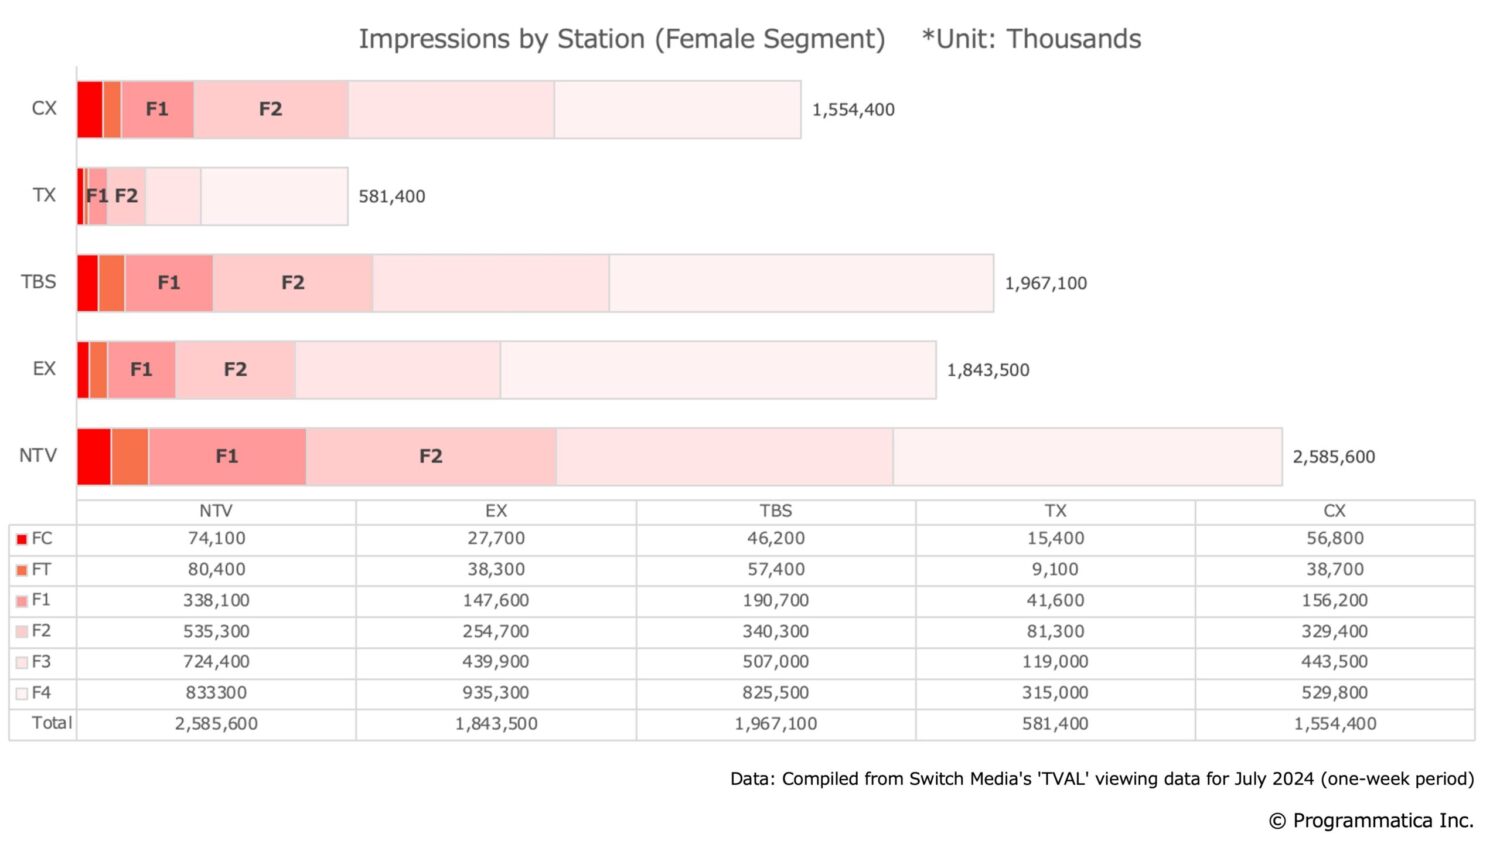
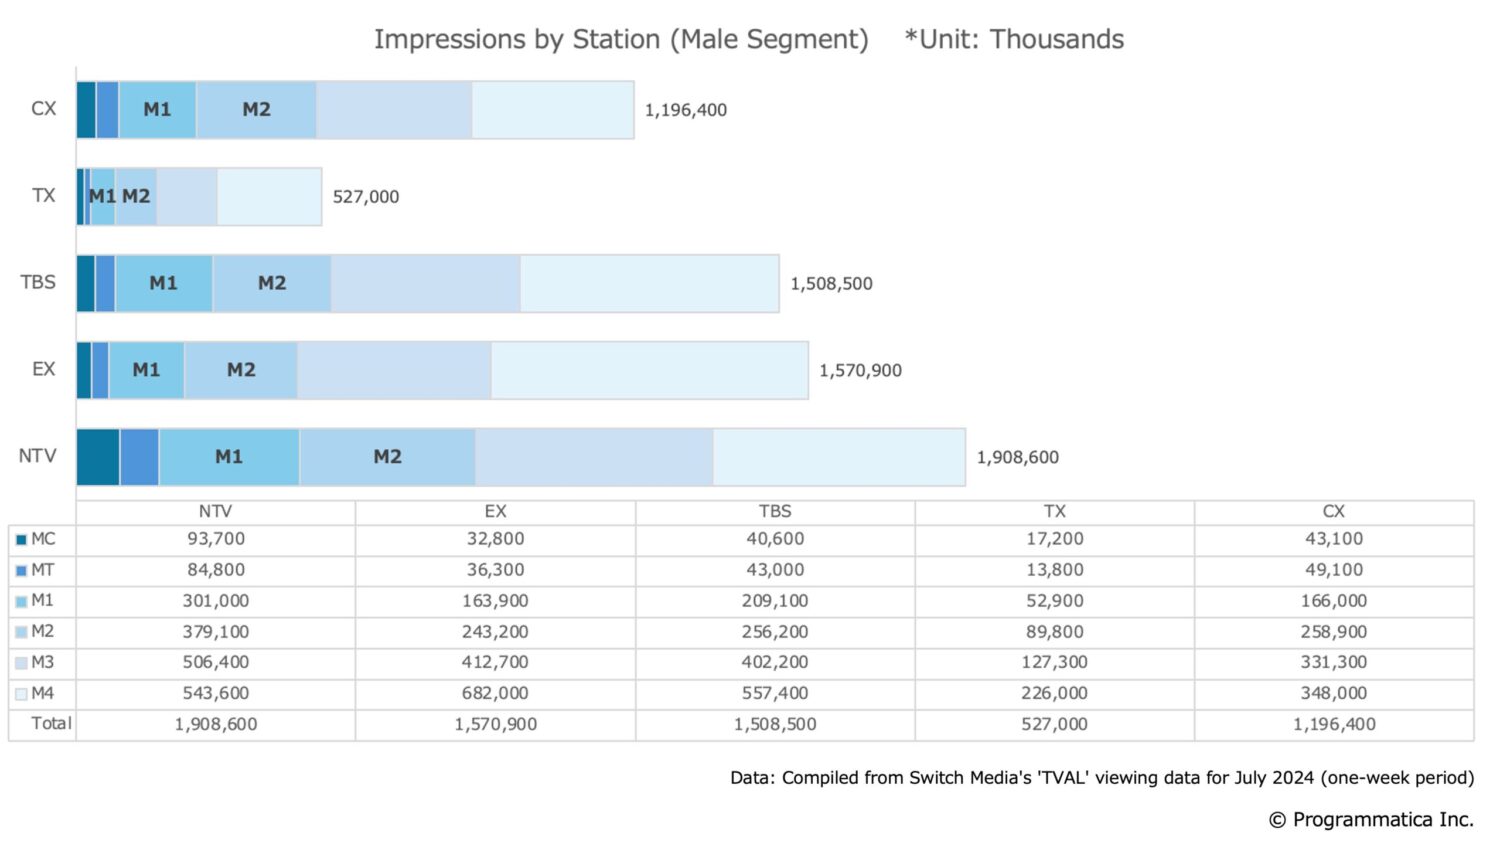
Impressions by Demographic
The following graph is a unique estimate by Programmatica, based on TVAL data, showing the number of impressions by demographic for key stations in the Tokyo area. We have categorized the data into female and male segments.
It is no longer necessary to explain that the proportion of older viewers is increasing across all stations. However, there are significant differences in audience composition between stations. The key issue is the variation in the number of impressions across stations. In particular, special attention should be given to the absolute number of younger viewers (MF1 and MF2)*.
*MF1: men & women aged 20-34, MF2: men & women aged 35-49
If a station with limited commercial inventory for a specific target segment participates in a cross-station transaction for a single segment, it will be at a significant disadvantage. This is because the proportion of premium ad slots within its commercial inventory will be high. Naturally, if transactions can be conducted at a CPM significantly higher than the current level, the potential for increased revenue will rise. So, what will that CPM be?
Evaluating the Potential for Impression Trading with Tokyo Key Stations
- Estimated Total Revenue: NTV
- Estimated Total Revenue: EX
- Estimated Total Revenue: TBS
- Estimated Total Revenue: TX
- Estimated Total Revenue: CX
- Decision Matrix
Average CPM for Each Station
Please don’t be disheartened by the low CPM of linear TV in Japan. This is the reality. Below are the CPM rates for all individuals.
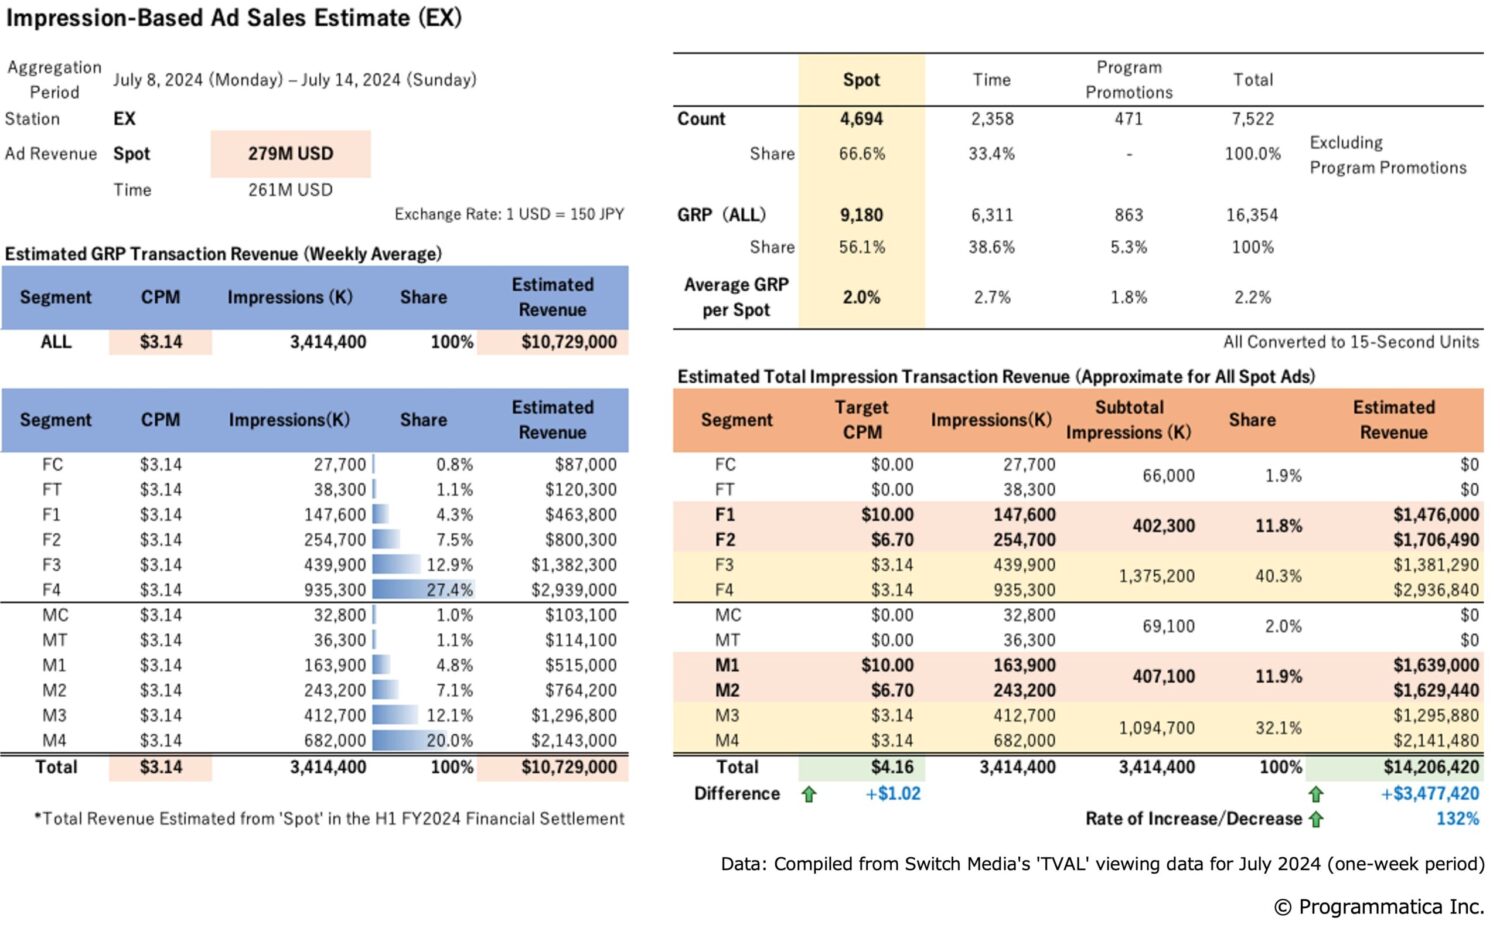
We estimate the total spot advertising revenue for each station based on impression-based trading, using data from one week in July 2024. Of course, not all commercial slots are traded based on impressions. However, to standardize the figures and compare the potential of each station’s overall audience composition, we have included all commercial slots in our analysis.
As a baseline, we have calculated the average CPM (cost per thousand ad impressions) by dividing each station’s average weekly spot revenue for the first half of fiscal year 2024 (six months) by 26 weeks, using the total number of impressions for all individuals.
| Station (Stn.) |
Avg. Weekly Spot Revenue (M USD) |
Total Individual Impressions | CPM Calculation (Cost per Mille) |
Avg. CPM (USD) |
| NTV | 13.57M | 4.50 billion | (13.57M ÷ 4.50B) × 1,000 | 3.02 |
| EX | 10.73M | 3.41 billion | (10.73M ÷ 3.41B) × 1,000 | 3.14 |
| TBS | 9.67M | 3.48 billion | (9.67M ÷ 3.48B) × 1,000 | 2.79 |
| TX | 3.26M | 1.11 billion | (3.26M ÷ 1.11B) × 1,000 | 2.94 |
| CX | 8.82M | 2.75 billion | (8.82M ÷ 2.75B) × 1,000 | 3.20 |
| *Exchange Rate: 1 USD = 150 JPY | ||||
The following is an examination of the potential of F1 (women aged 20-34) as a single segment impression transaction.
Estimated total revenue for NTV
First, we will estimate the total revenue for NTV. Since NTV’s F1 ratio is approximately 7.5%, we estimate the total revenue to be at least 100/7.5 times the average CPM of 3.02 USD, or 46.00 USD (about 7,000 JPY) per CPM, so it does not fall below the current total revenue. The current weekly average revenue of approximately 13.57 million USD would increase to15.56 million USD (115%) (an increase of approximately 2 million USD per week) based on simple calculations. However, this is not a sufficiently recoverable calculation result when you consider the “new system investment” (+cost) for impression transactions, as well as the assumption of “actual billing” (around -15%). At the very least, an increase in revenue of around 125-130% is necessary.
Also, not all ad slots are traded by impression, so if 10% are traded by impression, it is essential to understand that the expected increase will naturally be about 1/10 of this estimate.
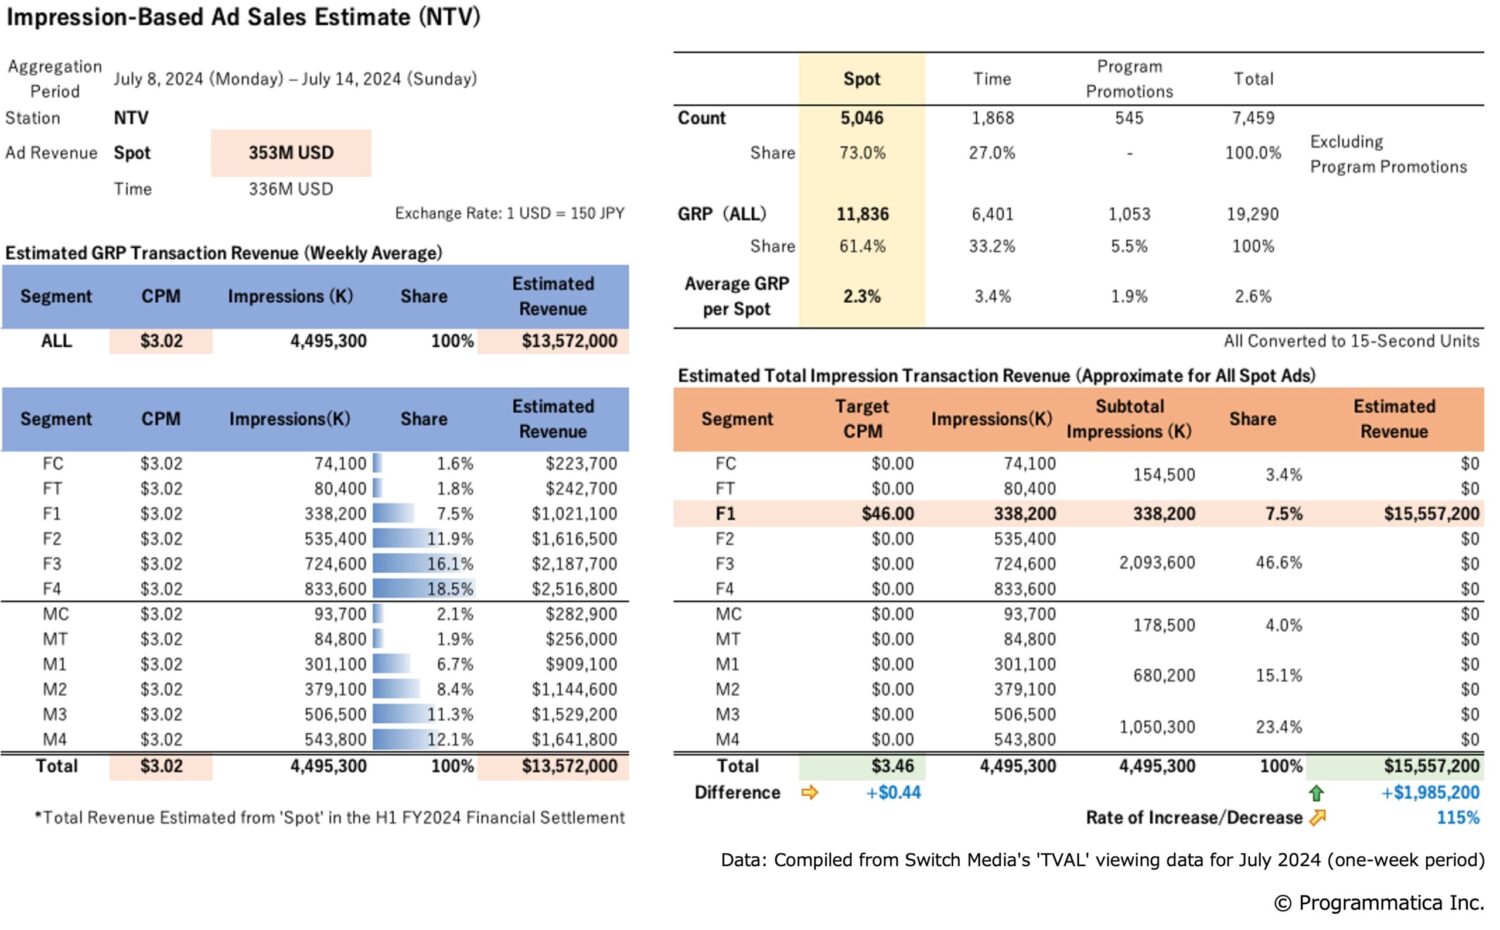
So, what would the calculations look like if other stations also traded impressions for this F1 segment at a CPM of 46.00 USD ? The results are as follows.
Estimate: F1 only, CPM46.00 USD (about 7,000 JPY)
| Stn. | F1 impression ratio |
Number of impressions (thousands) | Estimated total revenue (M USD) |
Percentage change |
| NTV | 7.5% | 338,200 | 15.57M(+1.99M) | 115%(+15%) |
| EX | 4.3% | 147,600 | 6.79M(-3.94M) | 63%(-37%) |
| TBS | 5.5% | 190,700 | 8.77M(-0.92M) | 90%(-10%) |
| TX | 3.8% | 41,600 | 1.91M(-1.34M) | 59%(-41%) |
| CX | 5.7% | 156,200 | 7.16M(-1.63M) | 82%(-18%) |
| *Exchange Rate: 1 USD = 150 JPY | ||||
The estimated total revenue for all stations except NTV has declined compared to the current situation. Impression trading does not necessarily lead to increased revenue. In particular, the risk is high because the F1 target ratio is low for each station. Therefore, we will conduct additional calculations by increasing the CPM while maintaining the F1 single segment.
Estimate: F1 only, CPM53.00 USD (about 8,000 JPY)
| Stn. | F1 impression ratio |
Number of impressions (thousands) | Estimated total revenue (M USD) |
Percentage change |
| NTV | 7.5% | 338,200 | 17.92M(+4.35M) | 132%(+32%) |
| EX | 4.3% | 147,600 | 7.82M(-2.91M) | 73%(-27%) |
| TBS | 5.5% | 190,700 | 10.11M(+0.41M) | 104%(+4%) |
| TX | 3.8% | 41,600 | 2.20M(-1.05M) | 68%(-32%) |
| CX | 5.7% | 156,200 | 8.28M(-0.54M) | 94%(-6%) |
| *Exchange Rate: 1 USD = 150 JPY | ||||
NTV’s growth rate was 132%. This indicates that NTV requires a minimum CPM of 60.00 USD when trading impressions for the F1 segment alone (single segment). TBS also barely managed to exceed 100%.
Estimate: F1 only, CPM60.00 USD (about 9,000 JPY)
| Stn. | F1 impression ratio |
Number of impressions (thousands) | Estimated total revenue (M USD) |
Percentage change |
| NTV | 7.5% | 338,200 | 20.29M(+6.72M) | 150%(+50%) |
| EX | 4.3% | 147,600 | 8.86M(-1.88M) | 83%(-17%) |
| TBS | 5.5% | 190,700 | 11.44M(+1.75M) | 118%(+18%) |
| TX | 3.8% | 41,600 | 2.50M(-0.76M) | 77%(-23%) |
| CX | 5.7% | 156,200 | 9.37M(+0.56M) | 106%(+6%) |
| *Exchange Rate: 1 USD = 150 JPY | ||||
While TBS and CX exceed 100%, EX and TX remain below breakeven. Ultimately, all Tokyo-based key stations require a CPM of 80 USD to break even with the current situation at 100%. However, considering that CPM for targeted CTV advertising on premium content ranges from 15.00 USD to 50 USD, trading F1 at this CPM is unrealistic.
Conducting impression trading for a single segment uniformly across all stations seems unreasonable. Ultimately, an impression trading system tailored to each station’s unique characteristics is essential.
Estimate: F1 only, CPM80.00 USD (about 12,000 JPY)
| Stn. | F1 impression ratio |
Number of impressions (thousands) | Estimated total revenue (M USD) | Percentage change |
| NTV | 7.5% | 338,200 | 27.06M(+13.48M) | 199%(+19%) |
| EX | 4.3% | 147,600 | 11.81M(+1.08M) | 110%(+10%) |
| TBS | 5.5% | 190,700 | 15.26M(+5.56M) | 157%(+57%) |
| TX | 3.8% | 41,600 | 3.33M(+0.07M) | 102%(+2%) |
| CX | 5.7% | 156,200 | 12.50M(+3.68M) | 142%(+42%) |
| *Exchange Rate: 1 USD = 150 JPY | ||||
A System Reflecting Each Station’s Uniqueness
So, can each station fully demonstrate its potential through Impression “Trading Based on Total Impression Evaluation ?” Of course, there are various possible patterns for CPM and target settings, but for now, we will keep the calculations as simple as possible.
Estimated Total Revenue for EX
It is uncertain whether EX would adopt impression-based trading for the F1 segment alone. However, even if we calculate based on a CPM of 80.00 USD, the growth rate would only reach around 110%.
If you aim to make a competitive deal while considering EX’s audience composition, which follows the “All-Target Strategy,” the growth rate can increase to 132% by setting CPMs at 10.00 USD for MF1, 6.70 USD for MF2, and an average of 3.14 USD for MF3/4*. Alternatively, impression-based deals targeting older demographics could also be effective.
*MF3: men & women aged 50-64, MF4: men & women aged 65 and over
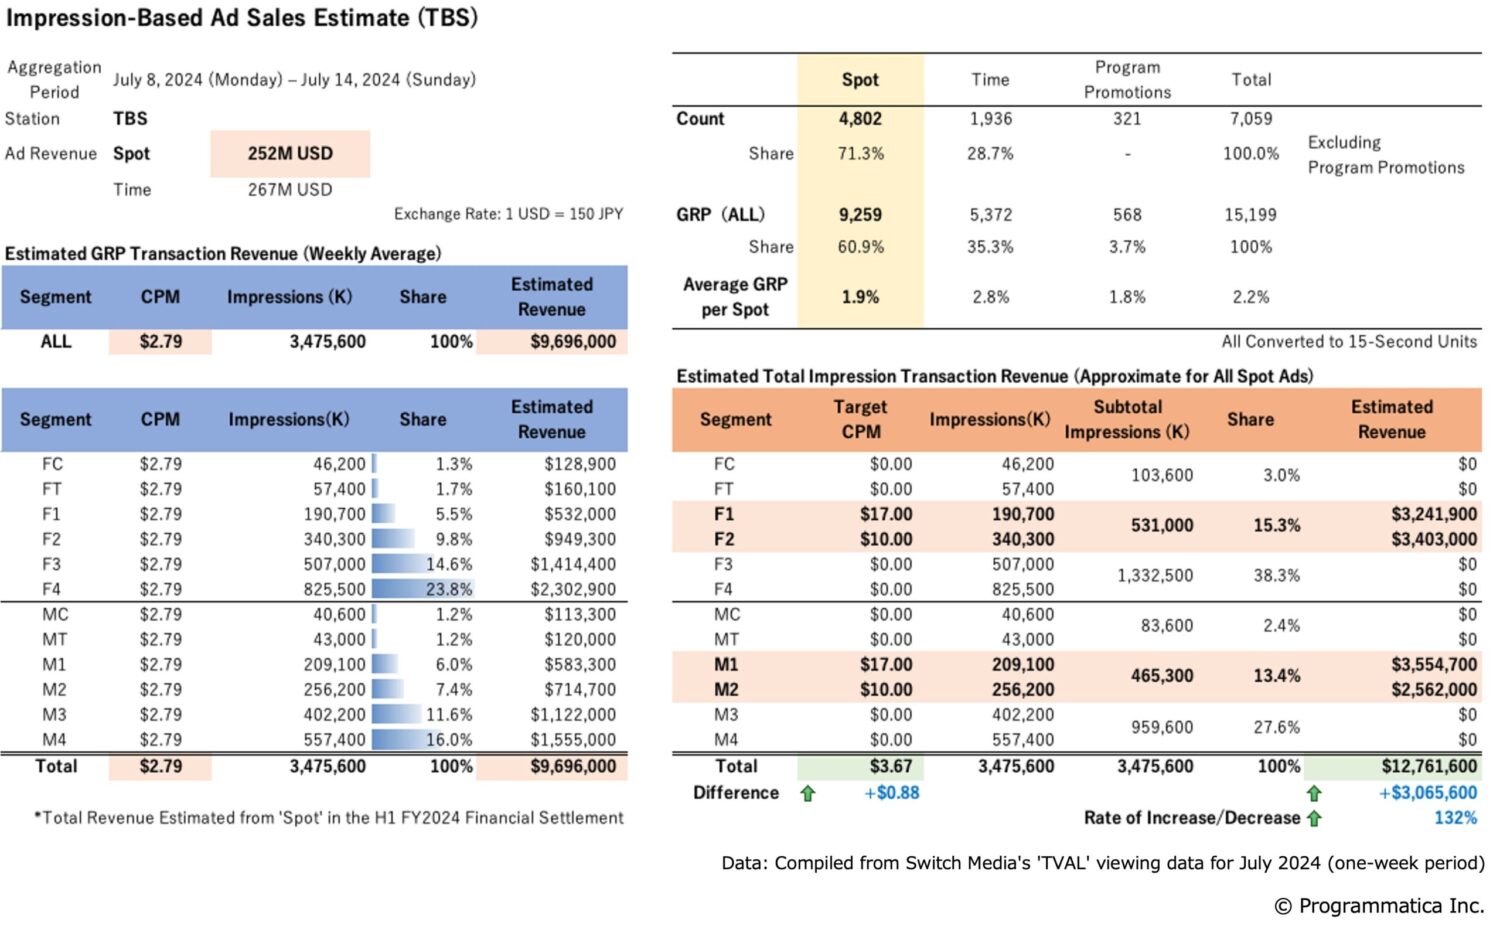
Estimated Total Revenue for TBS
Although TBS has a relatively similar audience composition to NTV, a CPM of at least 65-70 USD is necessary for F1 alone to achieve a sufficient revenue increase through impression trading.
It is more profitable to conduct impression trading with a competitively set CPM compared to CTV advertising, such as 17.00 USD for MF1 and 10.00 USD for MF2. Additionally, by utilizing Trading Based on Total Impression Evaluation, you can expand the target audience to the “LTV4-59” (men and women aged 4-59) while applying non-uniform CPM settings. For example, you can segment LTV4-59 into multiple tiers and create more efficient package deals.
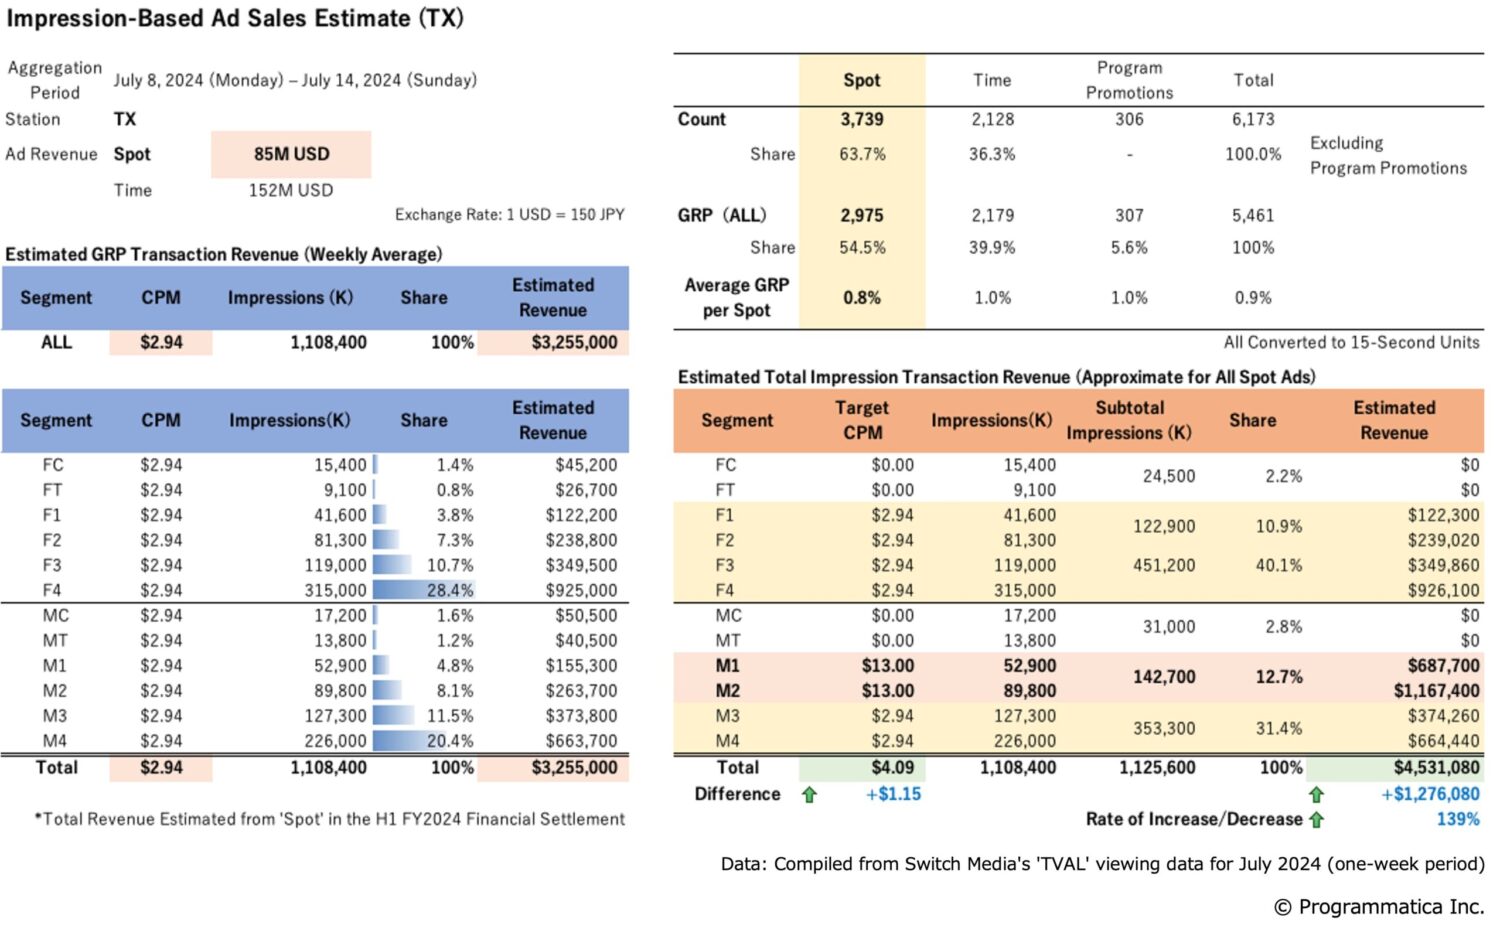
Estimated Total Revenue for TX
TX is known for attracting viewers who “go out of their way to choose and watch specific programs.” In that sense, it is likely possible to set a CPM that is aggressive and highly focused on specific segments.
In the example calculation, M1/2 is designated as the primary target with a CPM of 13.00 USD, while F1/2 and MF3/4 are set as peripheral targets with a CPM of 2.94 USD. However, it is also possible to conduct effective impression trading with F1/2 as the primary target.
Additionally, a broader target can be set, such as the “ALL + Sub U39” (all individuals + men and women aged 39 and under). In any case, the “packaged development” of impression trading with unique characteristics—similar to TBS—will further enhance its potential.
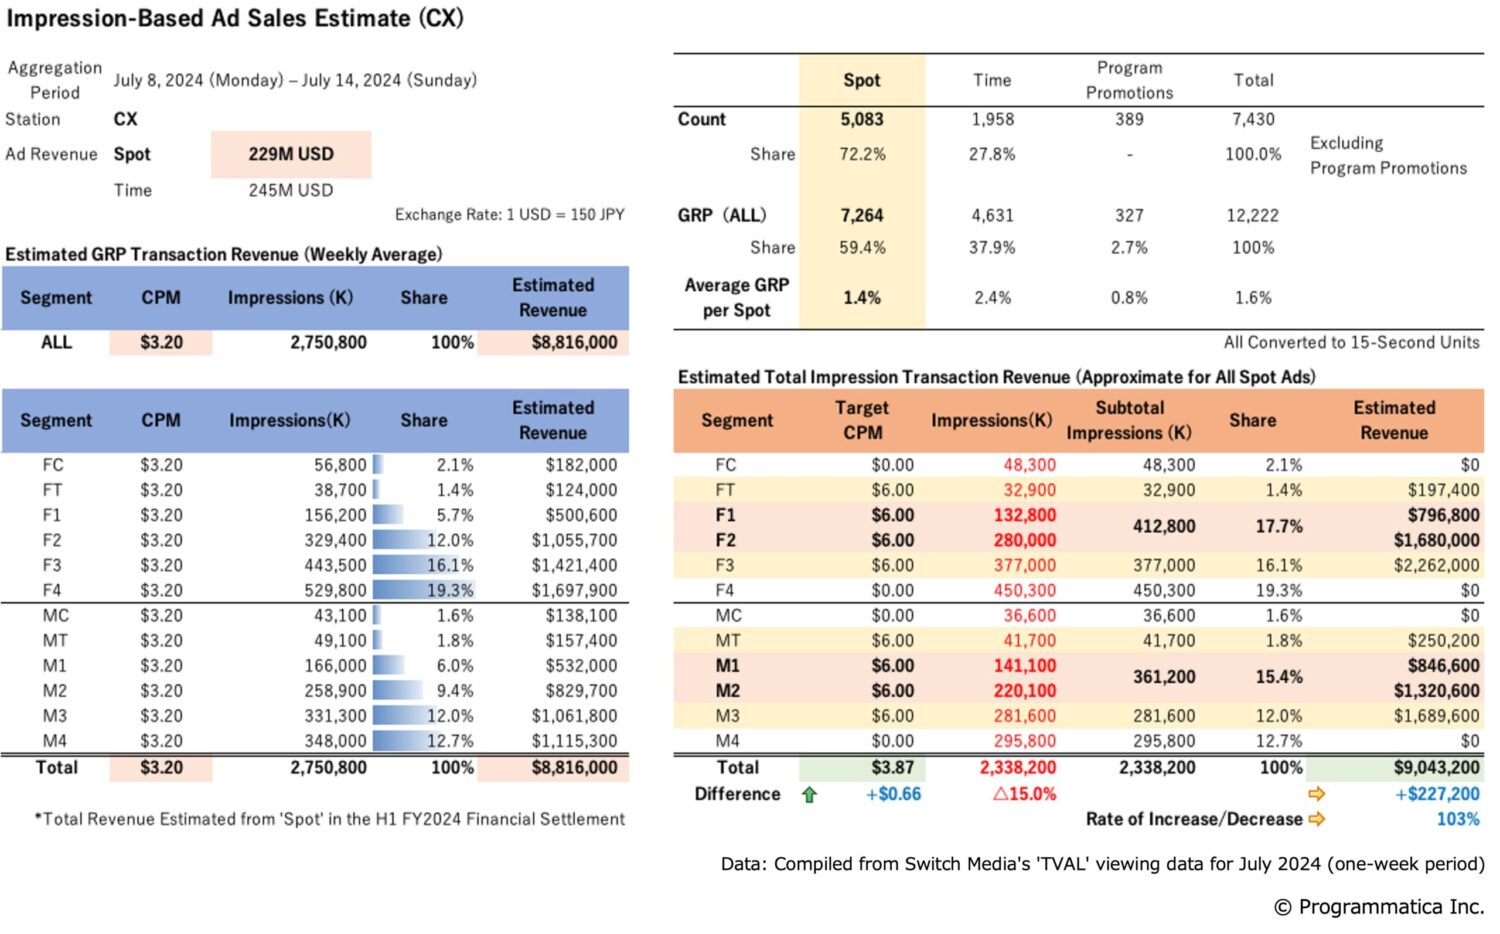
Estimated Total Revenue for CX
We revised the verification conducted at the end of 2024 in late January 2025 to account for the ongoing serious problem. Other stations estimate an increase in total revenue from impression trading. However, CX has revised its estimate to ”reduce the total number of impressions by around 15% (e.g., reducing the number of commercials by 15%) while maintaining the same level of total revenue as before”—a projection that minimizes the negative impact as much as possible.
We are currently estimating how much total revenue can be generated even with a CPM setting of less than 6.00 USD, based on the “Core +10” (men and women aged 13-59). The key factor here is to increase the average CPM. In the current challenging situation, achieving this with the existing GRP-based trading is nearly impossible, as increasing the “cost per %” in the midst of this turmoil is highly difficult. However, the newly introduced impression-based trading will present a strong opportunity for change.
As a result, it is well worth taking on the challenge of “not only neutralizing the negative impact but also turning it into a positive.”
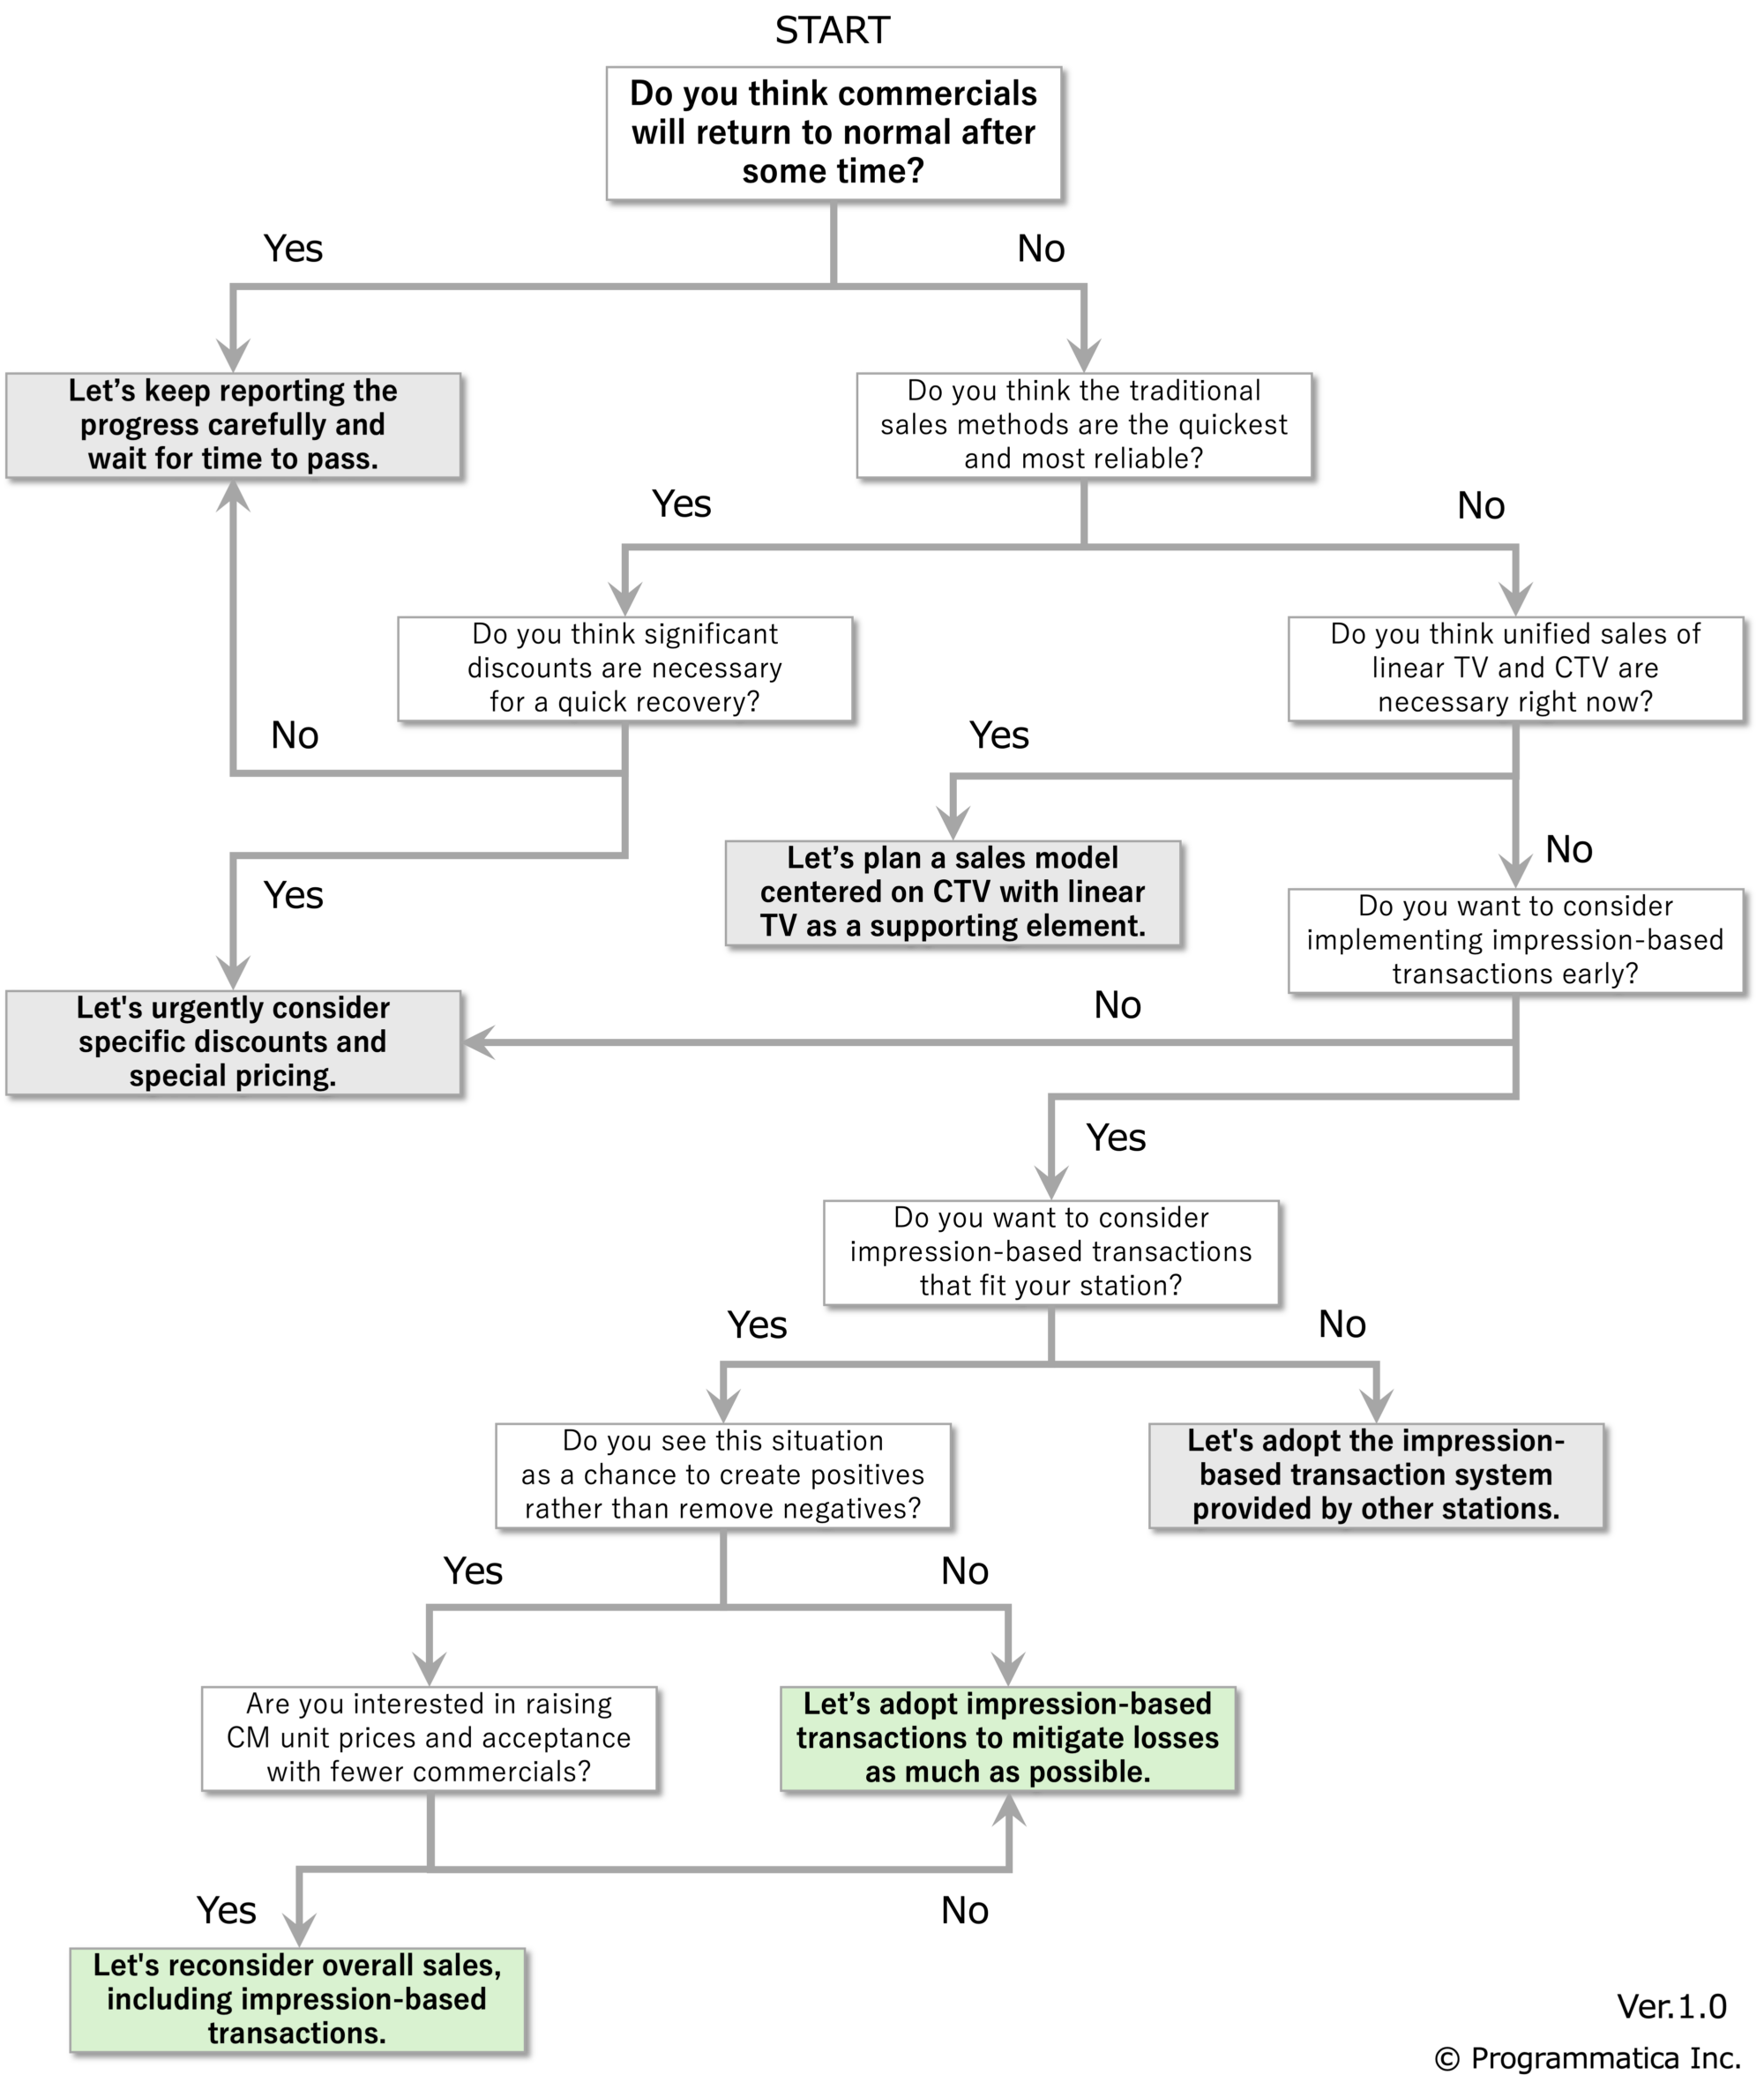
<Appendix> Let’s try the “Decision Matrix”.
This edition of PrograBLOG is the first in a series of posts excerpted from the study “Impression-Based TV Ad Sales: The Potential of Tokyo Key Stations.”
In the upcoming posts, we will explore key questions such as:
- What audience segments should be traded under total impression-based evaluation, and at what CPM?
- How can impression-based trading be packaged in a way that is clear and beneficial for both TV stations (sellers) and advertisers (buyers)?
- How much additional total revenue can be expected, and how will target efficiency improve?
Through these discussions, Programmatica aims to continue providing insights from our examination to raise awareness of impression-based trading for TV commercials in Japan and redefine the true value of TV advertising.
Yoshiteru Umeda
Programmatica Inc. Founder & CEO